viziphant.patterns.plot_patterns
- viziphant.patterns.plot_patterns(spiketrains, patterns, circle_sizes=(3, 50, 70), colors=None)[source]
Raster plot with one or more chosen SPADE or CAD patterns ot top shown in color.
Overlapping patterns (patterns that share neurons at a particular spike time) are represented as pie charts of individual pattern colors.
- Parameters:
- spiketrainslist of neo.SpikeTrain
List of spike trains that were used as the input.
- patternsdict or list of dict
One or more patterns from a list of found patterns returned by
elephant.spade.spade()orelephant.cell_assembly_detection.cell_assembly_detection()pattern detectors.- circle_sizestuple of float, optional
- A tuple of 3 elements:
raster plot neurons size that don’t participate in the patterns;
patterns circle size;
pie chart (overlapped patterns) size.
Default: (3, 50, 70)
- colorslist of str or None
A user-defined list of pattern colors. If None, the HSV colormap will be used to pick a different color for each pattern. Default: None
- Returns:
- axesmatplotlib.axes.Axes
Examples
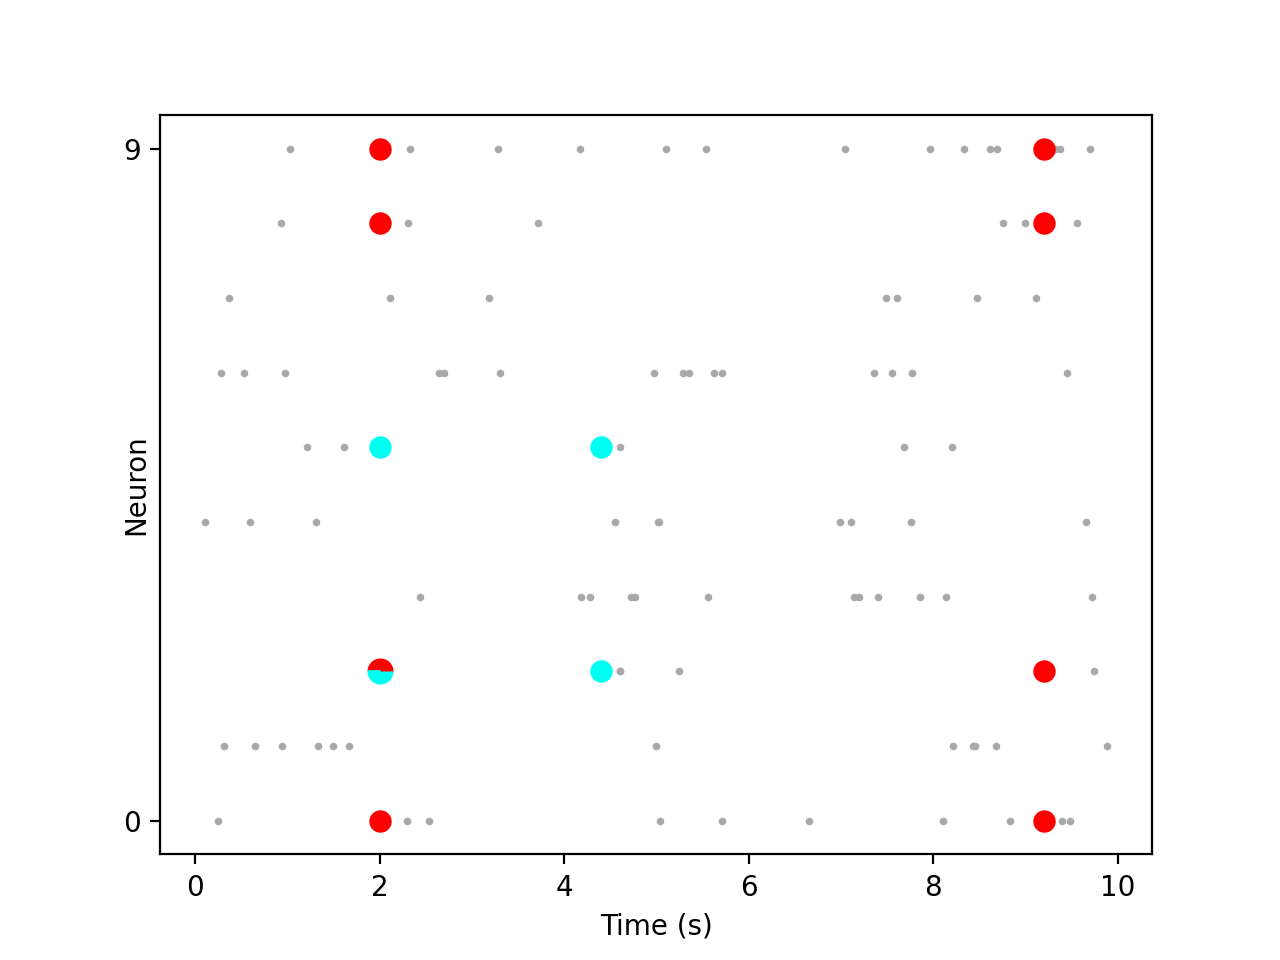
In the plot below, two SPADE patterns are shown with pie chars representing the overlapping patterns, which happen to have at least one common neuron active at the same time across two patterns found by SPADE analysis, letting the user to explore pattern sizes (the number of neurons participating in a pattern) versus the number of occurrences.
The bin size is set to a large value (
400ms) in order to find “patterns” from 10 realizations of homogeneous Poisson process.import numpy as np import quantities as pq import matplotlib.pyplot as plt from elephant import spade from elephant.spike_train_generation import homogeneous_poisson_process import viziphant np.random.seed(5) spiketrains = [homogeneous_poisson_process(rate=1 * pq.Hz, t_stop=10 * pq.s) for _ in range(10)] patterns = spade.spade(spiketrains, bin_size=400 * pq.ms, winlen=1)['patterns'] axes = viziphant.patterns.plot_patterns(spiketrains, patterns[:2]) plt.show()
(
Source code,png,hires.png,pdf)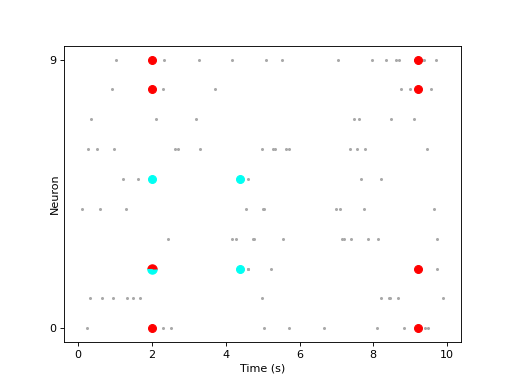
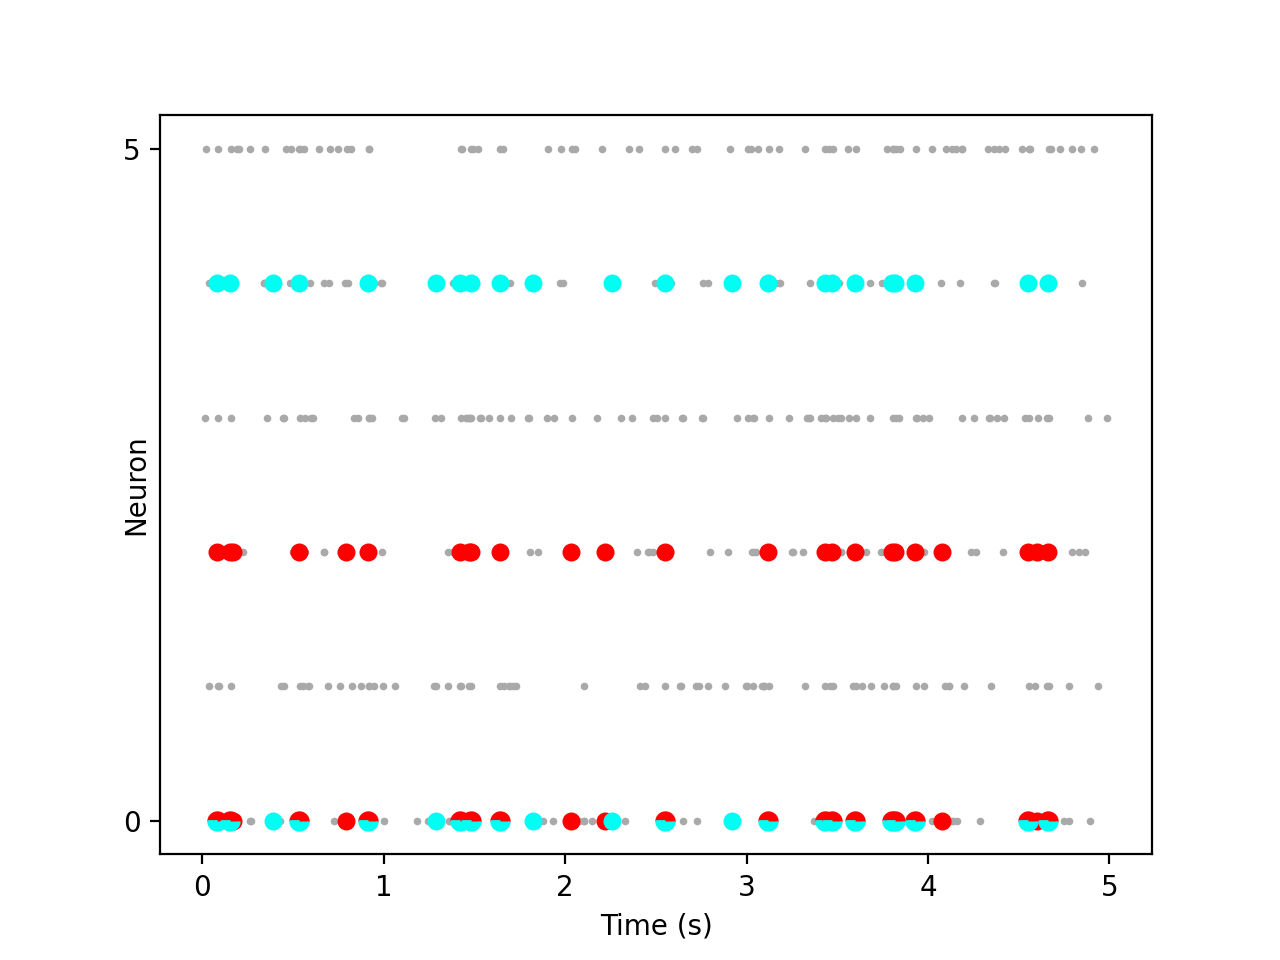
CAD example:
import matplotlib.pyplot as plt
import numpy as np
import quantities as pq
from elephant.cell_assembly_detection import cell_assembly_detection
from elephant.conversion import BinnedSpikeTrain
from elephant.spike_train_generation import compound_poisson_process
import viziphant

np.random.seed(30)
spiketrains = compound_poisson_process(rate=15 * pq.Hz,
    amplitude_distribution=[0, 0.95, 0, 0, 0, 0, 0.05], t_stop=5*pq.s)
bst = BinnedSpikeTrain(spiketrains, bin_size=10 * pq.ms)
bst.rescale('ms')
patterns = cell_assembly_detection(bst, max_lag=2)

viziphant.patterns.plot_patterns(spiketrains, patterns=patterns[:2],
                                 circle_sizes=(3, 30, 40))
plt.show()
(
Source code,png,hires.png,pdf)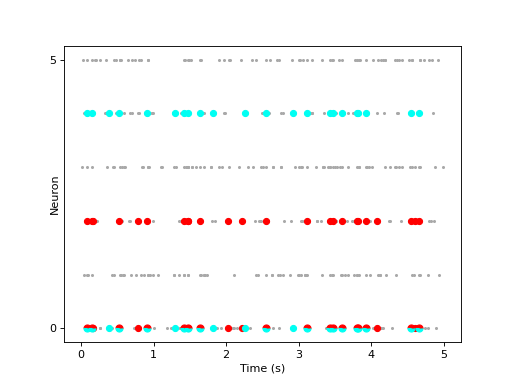
Additionally, one can add events to the returned axes:
event = neo.Event([0.5, 3.8] * pq.s, labels=['Trig ON', 'Trig OFF'])
viziphant.events.add_event(axes, event=event)