viziphant.events.add_event
- viziphant.events.add_event(axes, event, key=None, rotation=40, exclude=None)[source]
Add event(s) to axes plot.
If axes is a list of Axes, they are assumed to be top-down aligned, and the annotation text will be displayed on the first (uppermost) axis.
Original input
event.timesunits are used. If you want to use units other than the inputs, e.g. milliseconds, rescale the event manually by performingevent = event.rescale('ms').- Parameters:
- axesmatplotlib.axes.Axes or list
Matplotlib Axes handle or list of Axes.
- eventneo.Event
A neo.Event instance that contains labels or array_annotations and time points when the event(s) is occurred.
- keystr or None, optional
If set to not None, the event labels will be extracted from
event.array_annotations[key]. Otherwise, event labels are extracted fromevent.labels. Default: None- rotationint, optional
Text label rotation in degrees. Default : 40
- excludelist, optional
List of event labels that should not be plotted. Default: None
Examples
import neo
import quantities as pq
import matplotlib.pyplot as plt
from viziphant.events import add_event
fig, axes = plt.subplots()
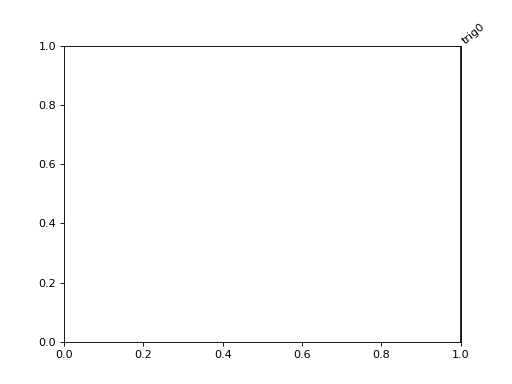
event = neo.Event([1, 6, 9] * pq.s, labels=['trig0', 'trig1', 'trig2'])
add_event(axes, event=event)
plt.show()
(
Source code,png,hires.png,pdf)
Refer to
viziphant.rasterplot.eventplot()for real scenarios.
