viziphant.asset.plot_synchronous_events
- viziphant.asset.plot_synchronous_events(spiketrains, sse, title=None, **kwargs)[source]
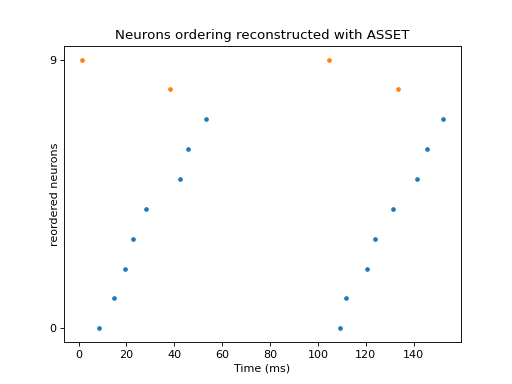
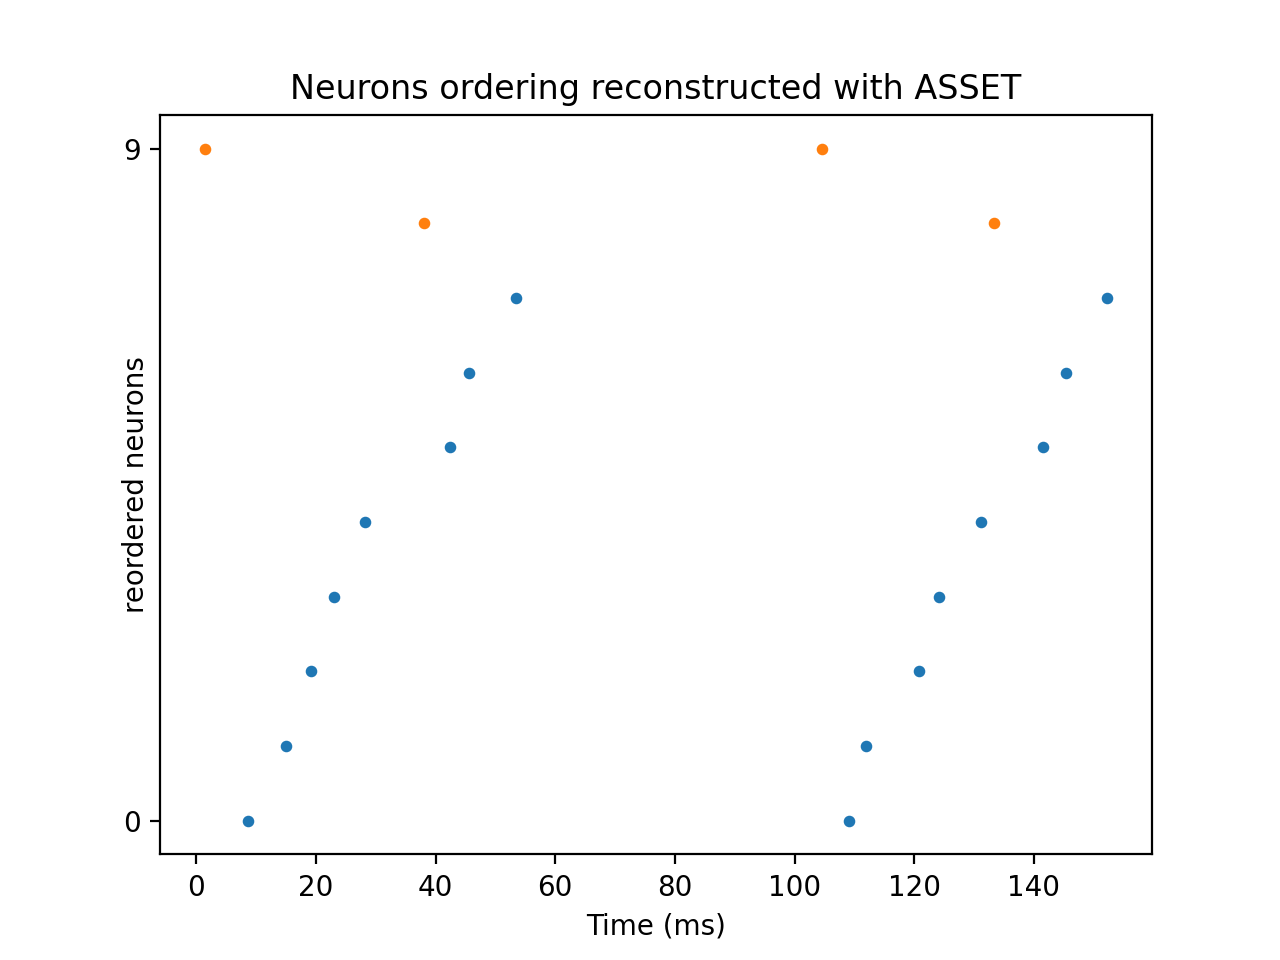
Reorder and plot the spiketrains according to a series of synchronous events sse obtained with the ASSET analysis. Spike trains that do not participate in the chosen group will be shown at the top in a different color.
- Parameters:
- spiketrainslist of neo.SpikeTrain
ASSET input spiketrains.
- ssedict
One entry of the output dict from
elephant.asset.ASSET.extract_synchronous_events().- titlestr or None, optional
User-defined title string. If None, it’ll be set to an automatic description. Default: None
- **kwargs
Additional arguments to
viziphant.rasterplot.rasterplot()
- Returns:
- axesmatplotlib.Axes.axes
See also
viziphant.patterns.plot_patternsplot patterns repeated in time
Examples
In this example we
simulate two noisy synfire chains;
shuffle the neurons to destroy visual appearance;
run ASSET analysis to recover the original neurons arrangement.
import neo
import numpy as np
import quantities as pq
import matplotlib.pyplot as plt

import viziphant
from elephant import asset

np.random.seed(10)
spiketrain = np.linspace(0, 50, num=10)
np.random.shuffle(spiketrain)
spiketrains = np.c_[spiketrain, spiketrain + 100]
spiketrains += np.random.random_sample(spiketrains.shape) * 5
spiketrains = [neo.SpikeTrain(st, units='ms', t_stop=1 * pq.s)
               for st in spiketrains]
asset_obj = asset.ASSET(spiketrains, bin_size=3 * pq.ms)

imat = asset_obj.intersection_matrix()
pmat = asset_obj.probability_matrix_analytical(imat,
                                               kernel_width=50 * pq.ms)
jmat = asset_obj.joint_probability_matrix(pmat, filter_shape=(5, 1),
                                          n_largest=3)
mmat = asset_obj.mask_matrices([pmat, jmat], thresholds=.9)
cmat = asset_obj.cluster_matrix_entries(mmat, max_distance=11,
                                        min_neighbors=3, stretch=5)
sses = asset_obj.extract_synchronous_events(cmat)

viziphant.asset.plot_synchronous_events(spiketrains, sse=sses[1], s=10)
plt.show()
(
Source code,png,hires.png,pdf)
Refer to ASSET tutorial for real-case scenario.