viziphant.rasterplot.rasterplot
- viziphant.rasterplot.rasterplot(spiketrains, axes=None, histogram_bins=0, title=None, color=None, **kwargs)[source]
Simple and fast raster plot of spike times.
- Parameters:
- spiketrainslist of neo.SpikeTrain or pq.Quantity
A list of neo.SpikeTrain objects or quantity arrays with spike times.
- axesmatplotlib.axes.Axes or None, optional
Matplotlib axes handle. If None, new axes are created and returned. Default: None
- histogram_binsint, optional
Defines the number of histogram bins. If set to
0, no histogram is shown. Default: 0- titlestr or None, optional
The axes title. Default: None
- colorstr or list of str or None, optional
Raster colors. Default: None
- **kwargs
Additional parameters passed to matplotlib scatter function.
- Returns:
- axesmatplotlib.Axes.axes
See also
rasterplot_ratesadvanced raster plot
eventplotplot spike times in vertical stripes
Examples
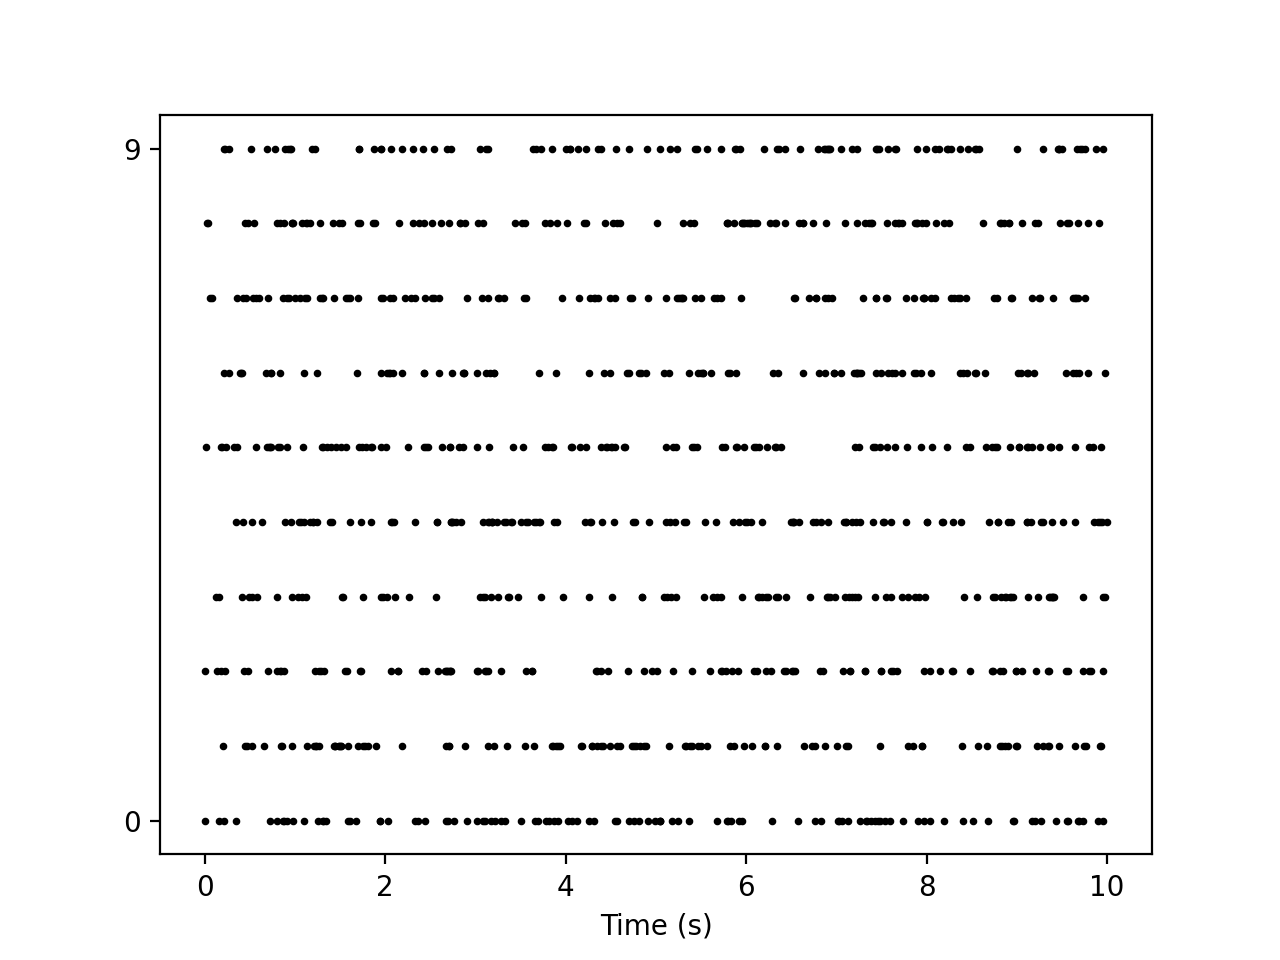
Basic example.
import numpy as np
import quantities as pq
import matplotlib.pyplot as plt
from elephant.spike_train_generation import homogeneous_poisson_process
from viziphant.rasterplot import rasterplot
np.random.seed(7)
spiketrains = [homogeneous_poisson_process(rate=10*pq.Hz,
               t_stop=10*pq.s) for _ in range(10)]
rasterplot(spiketrains, s=3, c='black')
plt.show()
(
Source code,png,hires.png,pdf)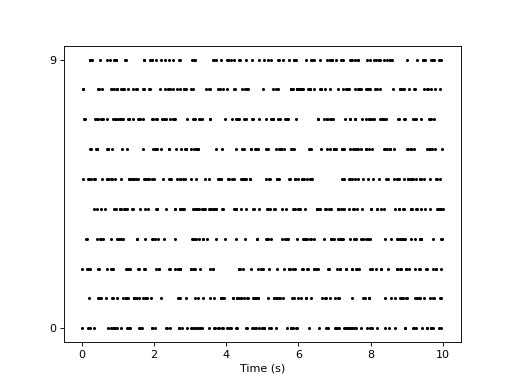
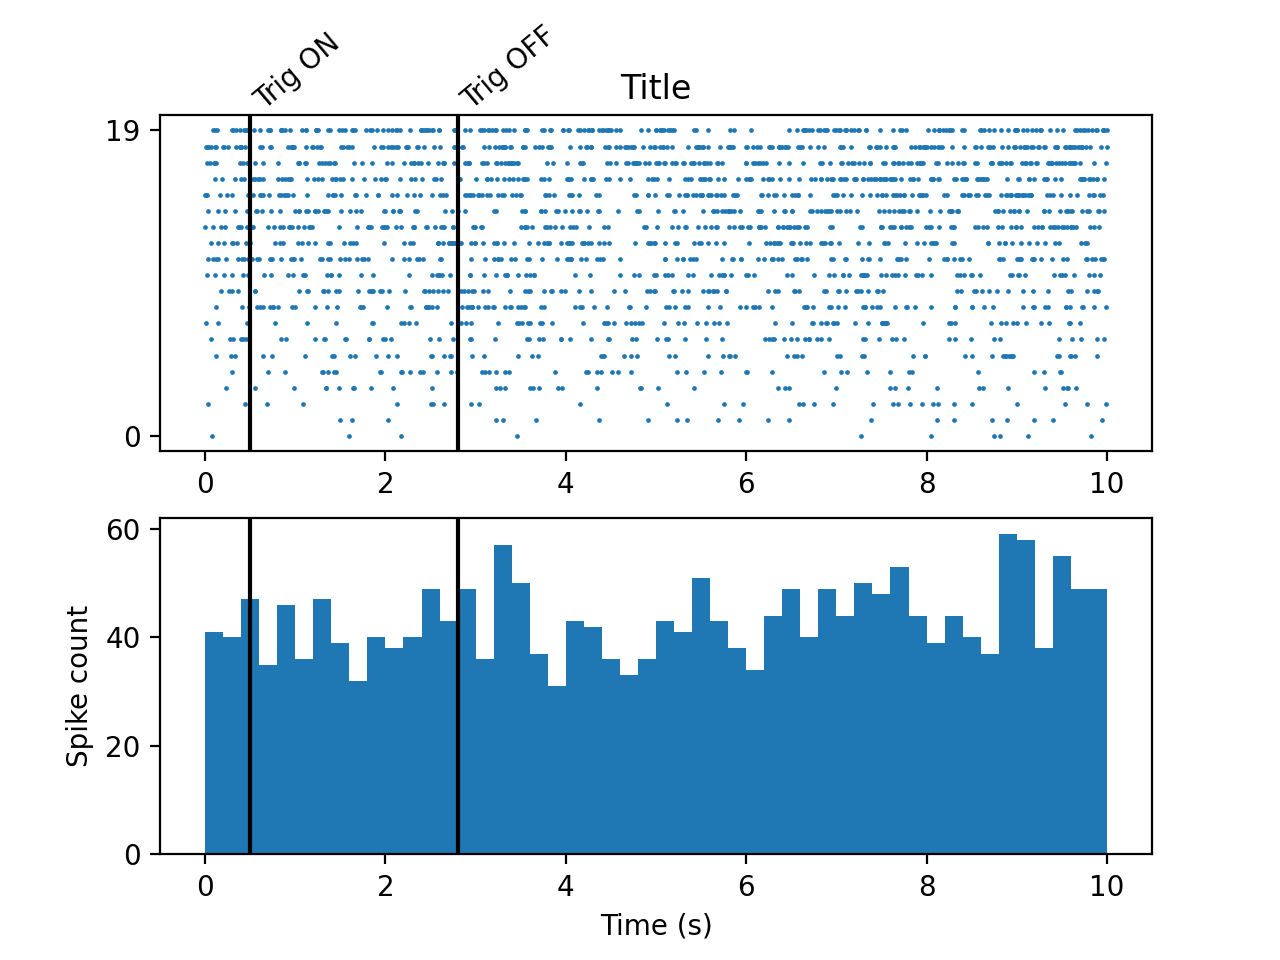
Raster plot with a histogram and events.
import neo
import numpy as np
import quantities as pq
import matplotlib.pyplot as plt
from elephant.spike_train_generation import homogeneous_poisson_process
from viziphant.rasterplot import rasterplot
from viziphant.events import add_event

np.random.seed(7)
spiketrains = [homogeneous_poisson_process(rate=r * pq.Hz,
               t_stop=10 * pq.s) for r in range(1, 21)]
event = neo.Event([0.5, 2.8] * pq.s, labels=['Trig ON', 'Trig OFF'])

axes = rasterplot(spiketrains, histogram_bins=50, title='Title', s=0.5)
add_event(axes, event=event)
plt.show()
(
Source code,png,hires.png,pdf)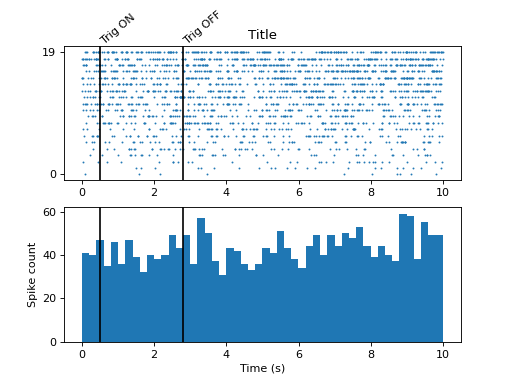