viziphant.rasterplot.eventplot
- viziphant.rasterplot.eventplot(spiketrains, axes=None, histogram_bins=0, title=None, **kwargs)[source]
Spike times eventplot with an additional histogram.
- Parameters:
- spiketrainslist of neo.SpikeTrain or pq.Quantity
A list of neo.SpikeTrain objects or quantity arrays with spike times.
- axesmatplotlib.axes.Axes or None
Matplotlib axes handle. If None, new axes are created and returned. Default: None
- histogram_binsint, optional
Defines the number of histogram bins. If set to
0, no histogram is shown. Default: 0- titlestr or None, optional
The axes title. Default: None
- **kwargs
Additional parameters passed to matplotlib eventplot function.
- Returns:
- axesmatplotlib.axes.Axes
See also
rasterplotsimplified raster plot
rasterplot_ratesadvanced raster plot
Examples
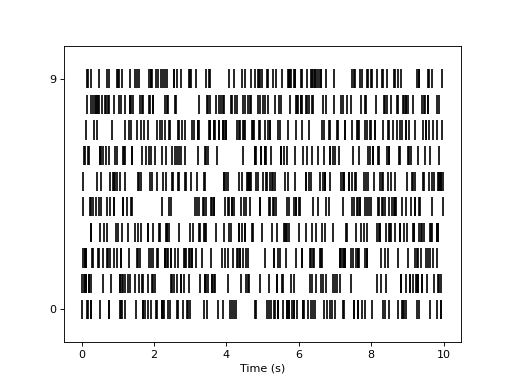
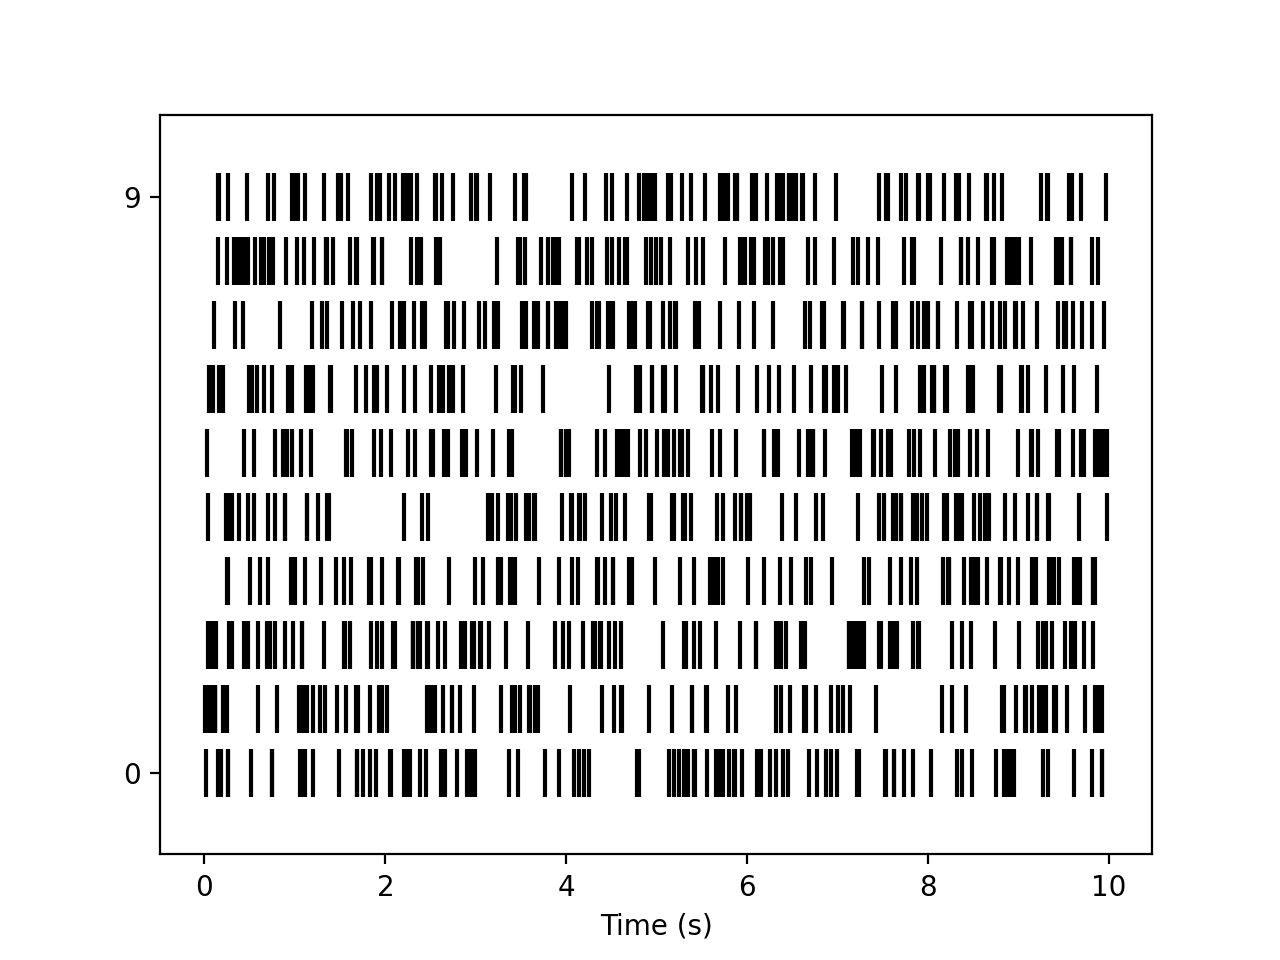
Basic spike times eventplot.
import numpy as np
import quantities as pq
import matplotlib.pyplot as plt
from elephant.spike_train_generation import homogeneous_poisson_process
from viziphant.rasterplot import eventplot
np.random.seed(12)
spiketrains = [homogeneous_poisson_process(rate=10*pq.Hz,
               t_stop=10*pq.s) for _ in range(10)]
eventplot(spiketrains, linelengths=0.75, color='black')
plt.show()
(
Source code,png,hires.png,pdf)
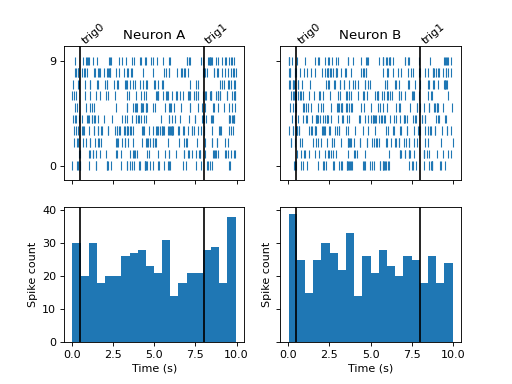
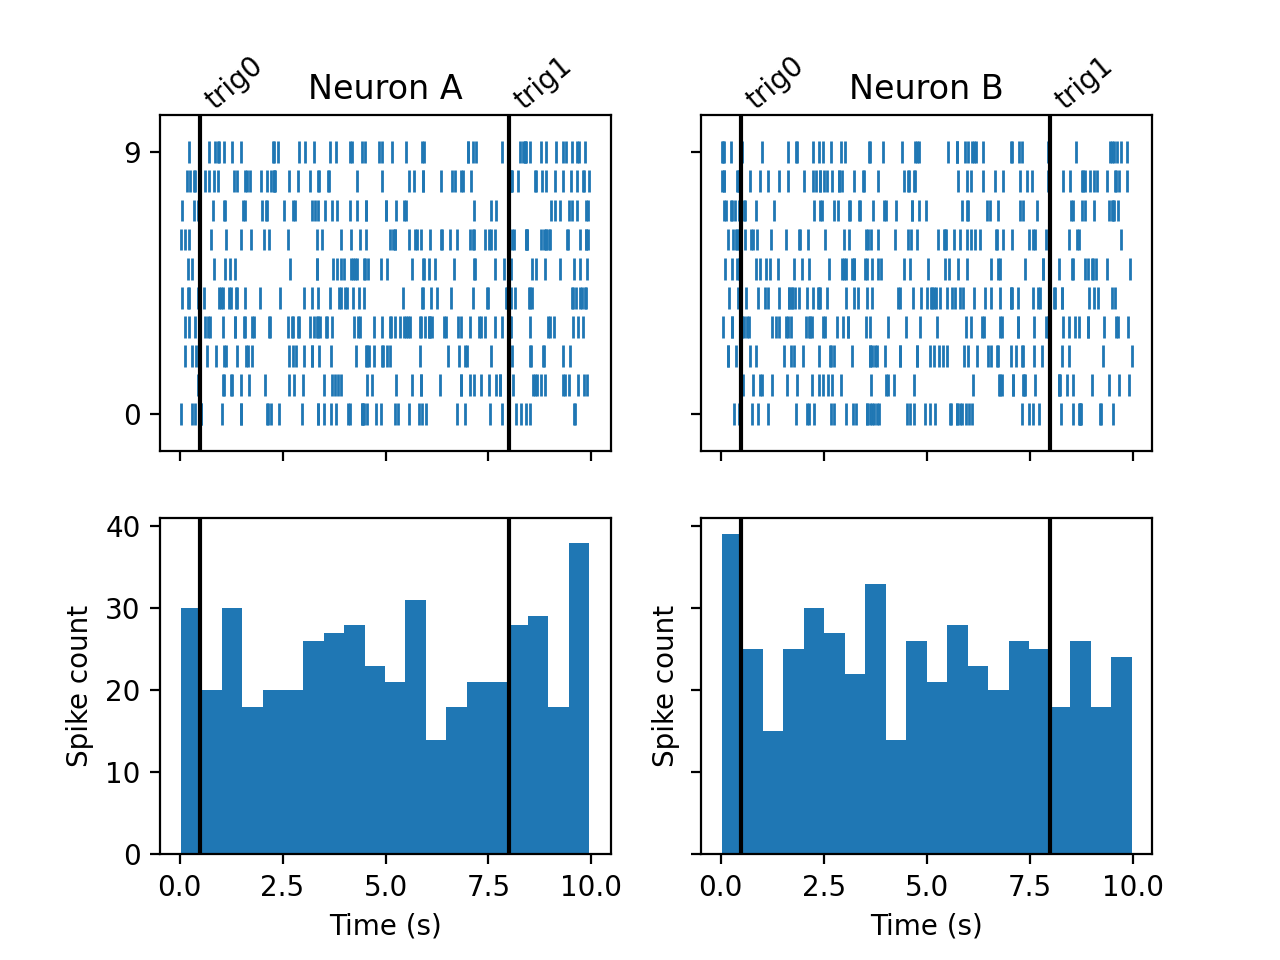
To plot with a histogram, provide a value for
histogram_bins. To compare spike times between different neurons, create matplotlib.axes.Axes instance prior to calling the function. Additionally, you can add events to the plot withviziphant.events.add_event()function.import neo import numpy as np import quantities as pq import matplotlib.pyplot as plt from elephant.spike_train_generation import homogeneous_poisson_process from viziphant.rasterplot import eventplot from viziphant.events import add_event np.random.seed(12) spiketrains = [homogeneous_poisson_process(rate=5*pq.Hz, t_stop=10*pq.s) for _ in range(20)] fig, axes = plt.subplots(2, 2, sharex=True, sharey='row') event = neo.Event([0.5, 8]*pq.s, labels=['trig0', 'trig1']) eventplot(spiketrains[:10], axes=axes[:, 0], histogram_bins=20, title="Neuron A", linelengths=0.75, linewidths=1) add_event(axes[:, 0], event) eventplot(spiketrains[10:], axes=axes[:, 1], histogram_bins=20, title="Neuron B", linelengths=0.75, linewidths=1) add_event(axes[:, 1], event) plt.show()
(
Source code,png,hires.png,pdf)