viziphant.spike_train_correlation.plot_corrcoef
- viziphant.spike_train_correlation.plot_corrcoef(corrcoef_matrix, axes=None, correlation_range='auto', colormap='bwr', colorbar_aspect=20, colorbar_padding_fraction=0.5, remove_diagonal=True)[source]
Plots a cross-correlation matrix returned by
elephant.spike_train_correlation.correlation_coefficient()function with a color bar.- Parameters:
- corrcoef_matrixnp.ndarray
Pearson’s correlation coefficient matrix
- axesmatplotlib.axes.Axes or None, optional
Matplotlib axes handle. If None, new axes are created and returned. Default: None
- correlation_range{‘auto’, ‘full’} or tuple of float, optional
Minimum and maximum correlations to consider for color mapping. If tuple, the first element is the minimum and the second element is the maximum correlation. If ‘auto’, the maximum absolute value of the non-diagonal coefficients will be used symmetrically as minimum and maximum. If ‘full’, maximum correlation is set at 1.0 and minimum at -1.0. Default: ‘auto’
- colormapstr, optional
Colormap. Default: ‘bwr’
- colorbar_aspectfloat, optional
Aspect ratio of the color bar. Default: 20
- colorbar_padding_fractionfloat, optional
Padding between matrix plot and color bar relative to color bar width. Default: 0.5
- remove_diagonalbool, optional
If True, the values in the main diagonal are replaced with zeros. Default: True
- Returns:
- axesmatplotlib.axes.Axes
- Raises:
- ValueError
If correlation_range is not tuple or ‘auto’ or ‘full’.
Examples
Create 10 homogeneous random Poisson spike trains of rate 10Hz and bin the spikes into bins of 100ms width, which is relatively large for such a firing rate, so we expect non-zero correlations.
import quantities as pq
from elephant.spike_train_generation import homogeneous_poisson_process
from elephant.conversion import BinnedSpikeTrain
from elephant.spike_train_correlation import correlation_coefficient
from viziphant.spike_train_correlation import plot_corrcoef
np.random.seed(0)

spiketrains = [homogeneous_poisson_process(rate=10*pq.Hz,
               t_stop=10*pq.s) for _ in range(10)]
binned_spiketrains = BinnedSpikeTrain(spiketrains, bin_size=100*pq.ms)
corrcoef_matrix = correlation_coefficient(binned_spiketrains)

fig, axes = plt.subplots()
plot_corrcoef(corrcoef_matrix, axes=axes)
axes.set_xlabel('Neuron')
axes.set_ylabel('Neuron')
axes.set_title("Correlation coefficient matrix")
plt.show()
(
Source code,png,hires.png,pdf)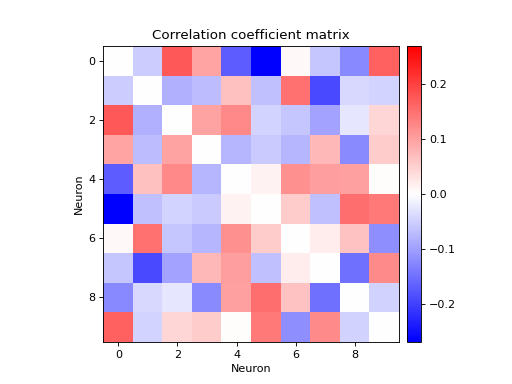