viziphant.statistics.plot_instantaneous_rates_colormesh
- viziphant.statistics.plot_instantaneous_rates_colormesh(rates, axes=None, units=None, **kwargs)[source]
Plots a colormesh of instantaneous firing rates. Each row represents a spike train the instantaneous rate was computed from.
- Parameters:
- ratesneo.AnalogSignal
neo.AnalogSignal matrix of shape
(len(spiketrains), time)containing instantaneous rates obtained byelephant.statistics.instantaneous_rate()function.- axesmatplotlib.axes.Axes or None, optional
Matplotlib axes handle. If set to None, new axes are created and returned.
- unitspq.Quantity or str or None, optional
Desired time axis units. If None,
histogram.sampling_periodunits are used. Default: None- **kwargs
Additional parameters passed to matplotlib pcolormesh function.
- Returns:
- figmatplotlib.figure.Figure
- axmatplotlib.axes.Axes
Examples
import quantities as pq
from elephant import statistics, kernels
import matplotlib.pyplot as plt
from elephant.spike_train_generation import homogeneous_poisson_process
from viziphant.statistics import plot_instantaneous_rates_colormesh
np.random.seed(6)
spiketrains = [homogeneous_poisson_process(rate=10 * pq.Hz,
               t_stop=10 * pq.s) for _ in range(10)]
kernel = kernels.GaussianKernel(sigma=100 * pq.ms)
rates = statistics.instantaneous_rate(spiketrains,
                                      sampling_period=10 * pq.ms,
                                      kernel=kernel)
plot_instantaneous_rates_colormesh(rates)
plt.show()
(
Source code,png,hires.png,pdf)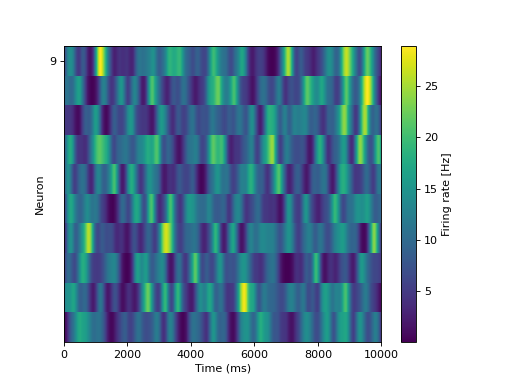