viziphant.spike_train_synchrony.plot_spike_contrast
- viziphant.spike_train_synchrony.plot_spike_contrast(trace, spiketrains=None, title=None, lw=1.0, xscale='log', **kwargs)[source]
Plot Spike-contrast synchrony measure (Ciba et al., 2018).
- Parameters:
- traceSpikeContrastTrace
The trace output from
elephant.spike_train_synchrony.spike_contrast()function.- spiketrainslist of neo.SpikeTrain or None
Input spike trains, optional. If provided, the raster plot will be shown at the bottom. Default: None
- titlestr or None.
The plot title. If None, an automatic description will be set. Default: None
- lwfloat, optional
The curves line width. Default: 1.0
- xscalestr, optional
X axis scale. Default: ‘log’
- **kwargs
Additional arguments, passed in
viziphant.rasterplot.rasterplot()
- Returns:
- axesmatplotlib.Axes.axes
Examples
Spike-contrast synchrony of homogenous Poisson processes.
import numpy as np
import quantities as pq
from elephant.spike_train_generation import homogeneous_poisson_process
from elephant.spike_train_synchrony import spike_contrast
import viziphant
np.random.seed(24)
spiketrains = [homogeneous_poisson_process(rate=20 * pq.Hz,
               t_stop=10 * pq.s) for _ in range(10)]
synchrony, trace = spike_contrast(spiketrains, return_trace=True)
viziphant.spike_train_synchrony.plot_spike_contrast(trace,
     spiketrains=spiketrains, c='gray', s=1)
plt.show()
(
Source code,png,hires.png,pdf)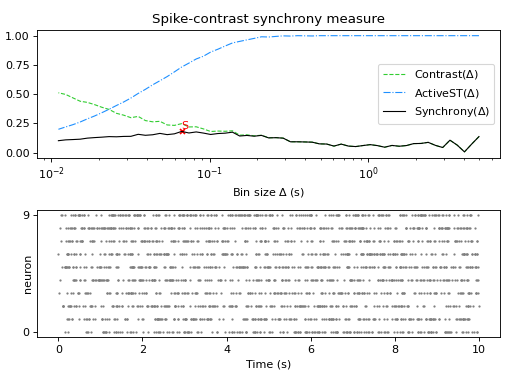