viziphant.statistics.plot_time_histogram
- viziphant.statistics.plot_time_histogram(histogram, axes=None, units=None)[source]
This function plots a time histogram, such as the result of
elephant.statistics.time_histogram().- Parameters:
- histogramneo.AnalogSignal
Object containing the histogram bins.
- axesmatplotlib.axes.Axes or None, optional
Matplotlib axes handle. If set to None, new axes are created and returned.
- unitspq.Quantity or str or None, optional
Desired time axis units. If None,
histogram.sampling_periodunits are used. Default: None
- Returns:
- axesmatplotlib.axes.Axes
Examples
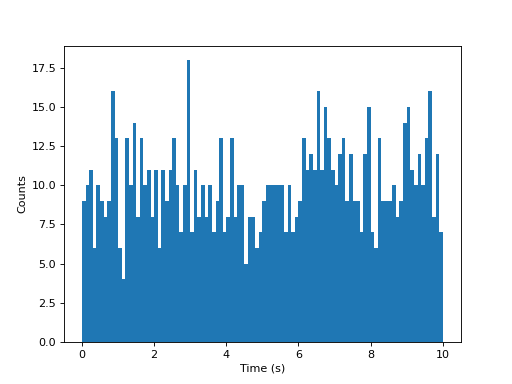
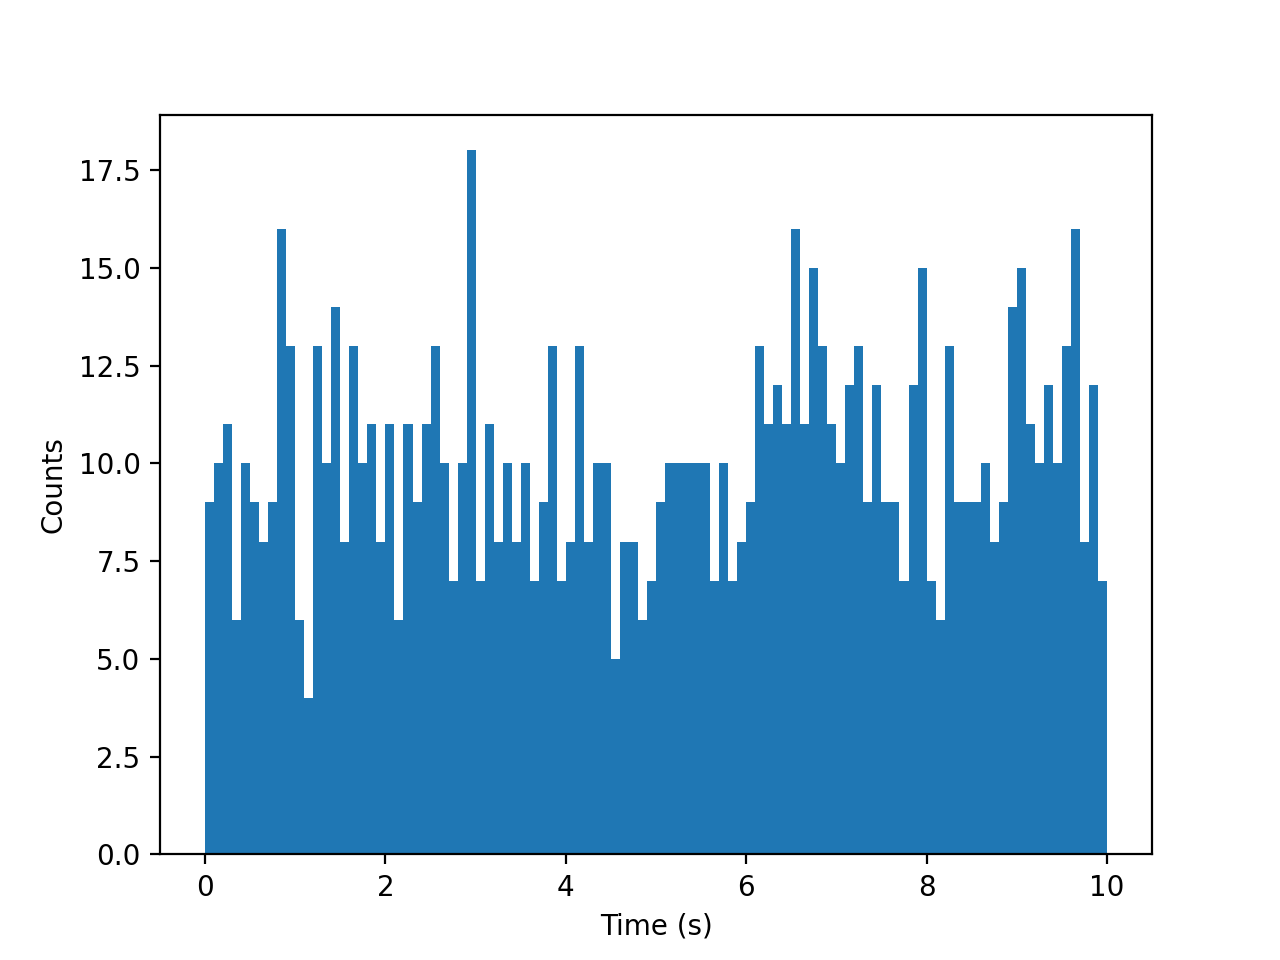
Basic example of spike count histogram.
import quantities as pq
import matplotlib.pyplot as plt
from elephant.spike_train_generation import homogeneous_poisson_process
from elephant import statistics
from viziphant.statistics import plot_time_histogram
np.random.seed(14)

spiketrains = [homogeneous_poisson_process(rate=10*pq.Hz,
               t_stop=10*pq.s) for _ in range(10)]
histogram = statistics.time_histogram(spiketrains, bin_size=100*pq.ms)

plot_time_histogram(histogram, units='s')
plt.show()
(
Source code,png,hires.png,pdf)
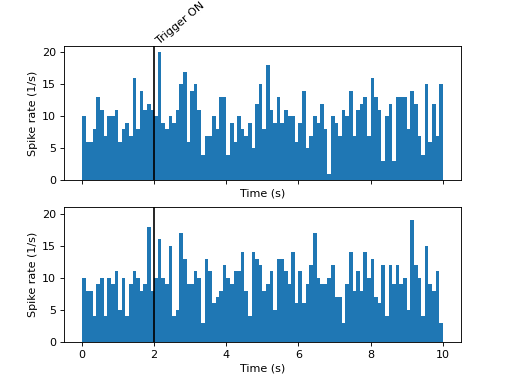
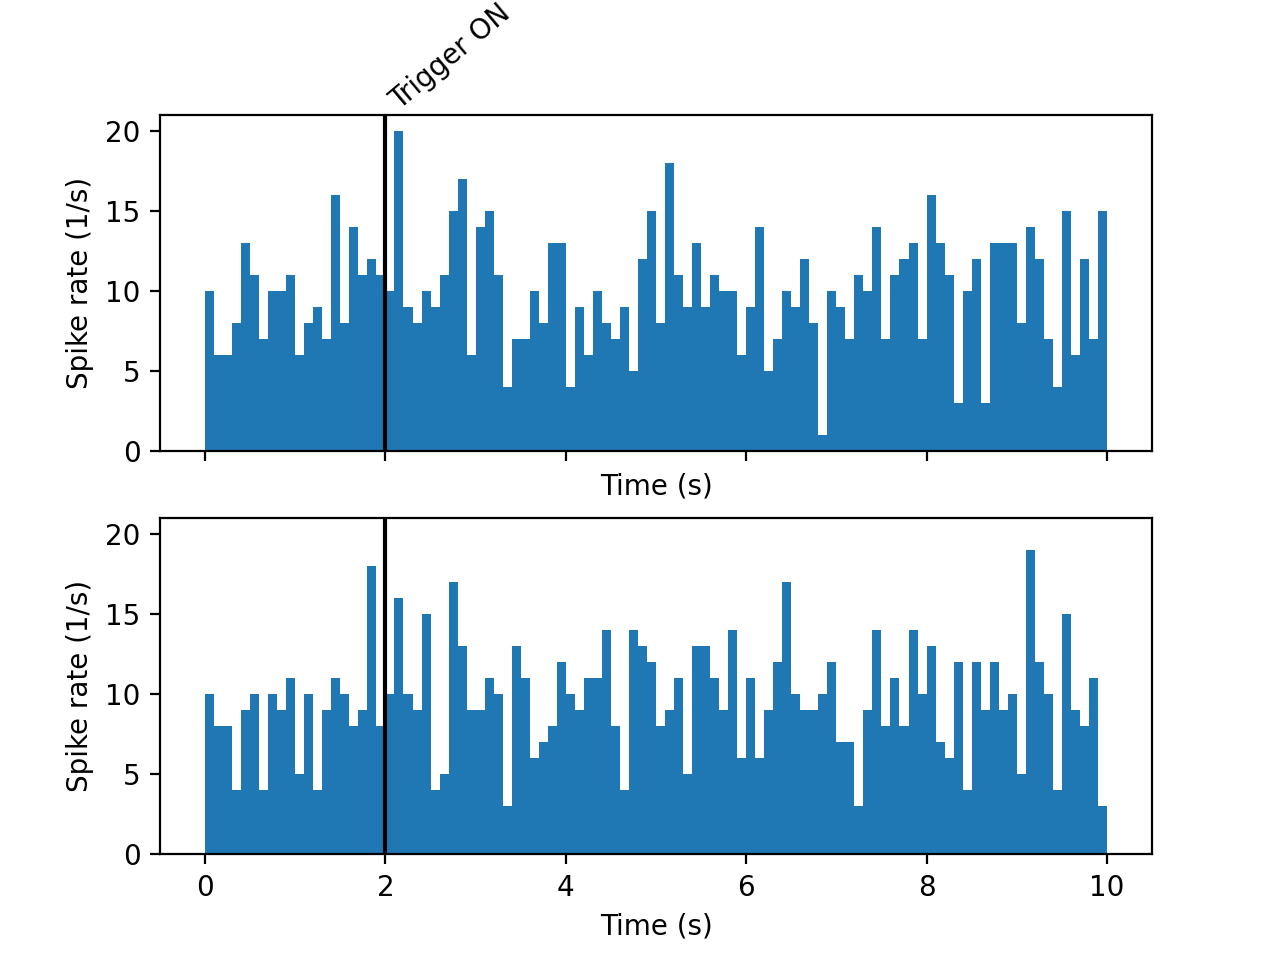
Multiple time histograms are shown side by side with a common event point.
import neo
import quantities as pq
import matplotlib.pyplot as plt
from elephant.spike_train_generation import homogeneous_poisson_process
from elephant import statistics
from viziphant.statistics import plot_time_histogram
from viziphant.events import add_event
np.random.seed(11)

fig, axes = plt.subplots(2, 1, sharex=True, sharey=True)
event = neo.Event([2]*pq.s, labels=['Trigger ON'])
for axis in axes:
    spiketrains = [homogeneous_poisson_process(rate=10 * pq.Hz,
                   t_stop=10 * pq.s) for _ in range(10)]
    histogram = statistics.time_histogram(spiketrains,
                                          bin_size=0.1 * pq.s,
                                          output='rate')
    plot_time_histogram(histogram, axes=axis, units='s')
add_event(axes, event=event)
plt.show()
(
Source code,png,hires.png,pdf)