viziphant.statistics.plot_isi_histogram
- viziphant.statistics.plot_isi_histogram(spiketrains, axes=None, bin_size=array(3.) * ms, cutoff=None, title='ISI distribution', legend=None, histtype='step')[source]
Create a simple histogram plot to visualise an inter-spike interval (ISI) distribution of spike trains.
Input spike trains are sorted in time prior to computing the ISI.
If the input is a list of list of spike trains, as in the Example 3, the ISI of a population is concatenated from all neuron spike trains.
- Parameters:
- spiketrainsneo.SpikeTrain or pq.Quantity or list
A spike train or a list of spike trains the ISI to be computed from.
- axesmatplotlib.axes.Axes or None, optional
Matplotlib axes handle. If set to None, new axes are created and returned. Default: None
- bin_sizepq.Quantity, optional
The bin size for the histogram. Default: 3 ms
- cutoffpq.Quantity or None, optional
The largest ISI to consider. Otherwise, if set to None, all range of values are plotted. Typical cutoff values are ~250 ms. Default: None
- titlestr, optional
The axes title. Default: ‘ISI distribution’
- legendstr or list of str or None, optional
The axes legend labels. Default: None
- histtypestr
Histogram type passed to matplotlib hist function. Default: ‘step’
- Returns:
- axesmatplotlib.axes.Axes
Examples
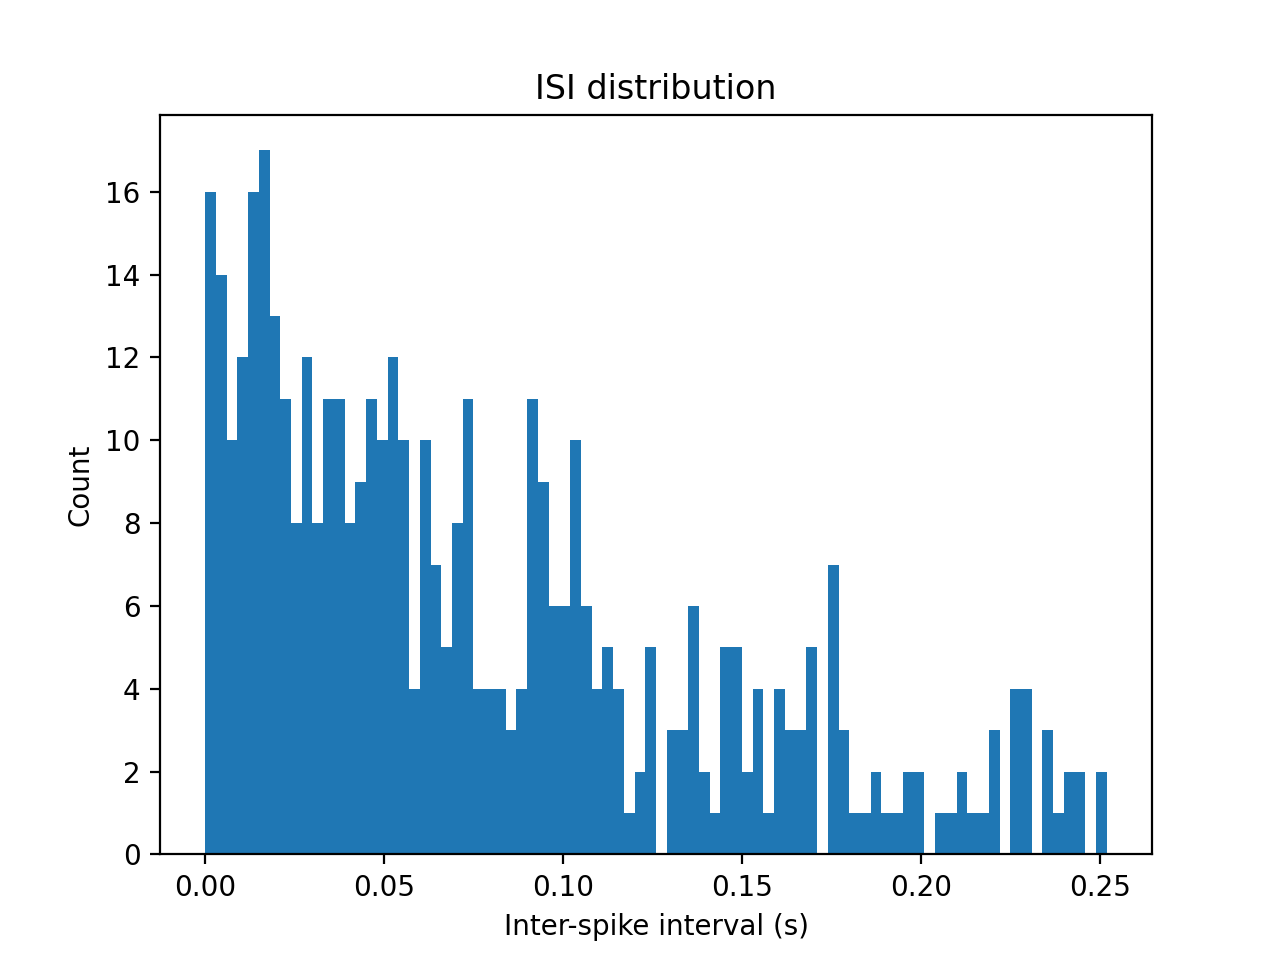
Basic ISI histogram plot.
import quantities as pq
import matplotlib.pyplot as plt
from elephant.spike_train_generation import homogeneous_poisson_process
from viziphant.statistics import plot_isi_histogram
np.random.seed(12)

spiketrain = homogeneous_poisson_process(rate=10*pq.Hz, t_stop=50*pq.s)
plot_isi_histogram(spiketrain, cutoff=250*pq.ms, histtype='bar')
plt.show()
(
Source code,png,hires.png,pdf)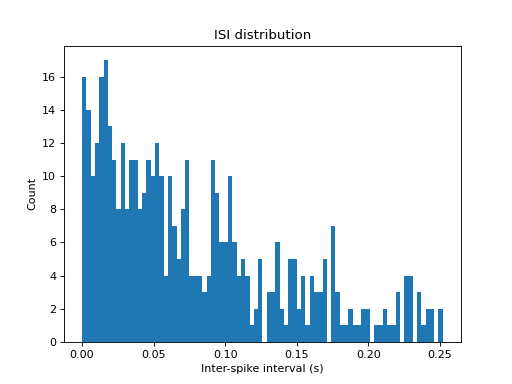
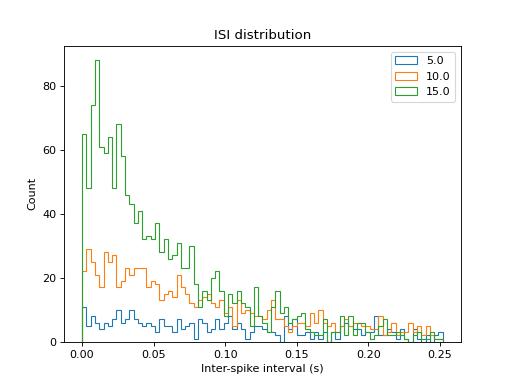
ISI histogram of multiple spike trains.
import quantities as pq
import matplotlib.pyplot as plt
from elephant.spike_train_generation import homogeneous_poisson_process
from viziphant.statistics import plot_isi_histogram
np.random.seed(12)
rates = [5, 10, 15] * pq.Hz
spiketrains = [homogeneous_poisson_process(rate=r,
               t_stop=100 * pq.s) for r in rates]
plot_isi_histogram(spiketrains, cutoff=250*pq.ms,
                   legend=rates)
plt.show()
(
Source code,png,hires.png,pdf)
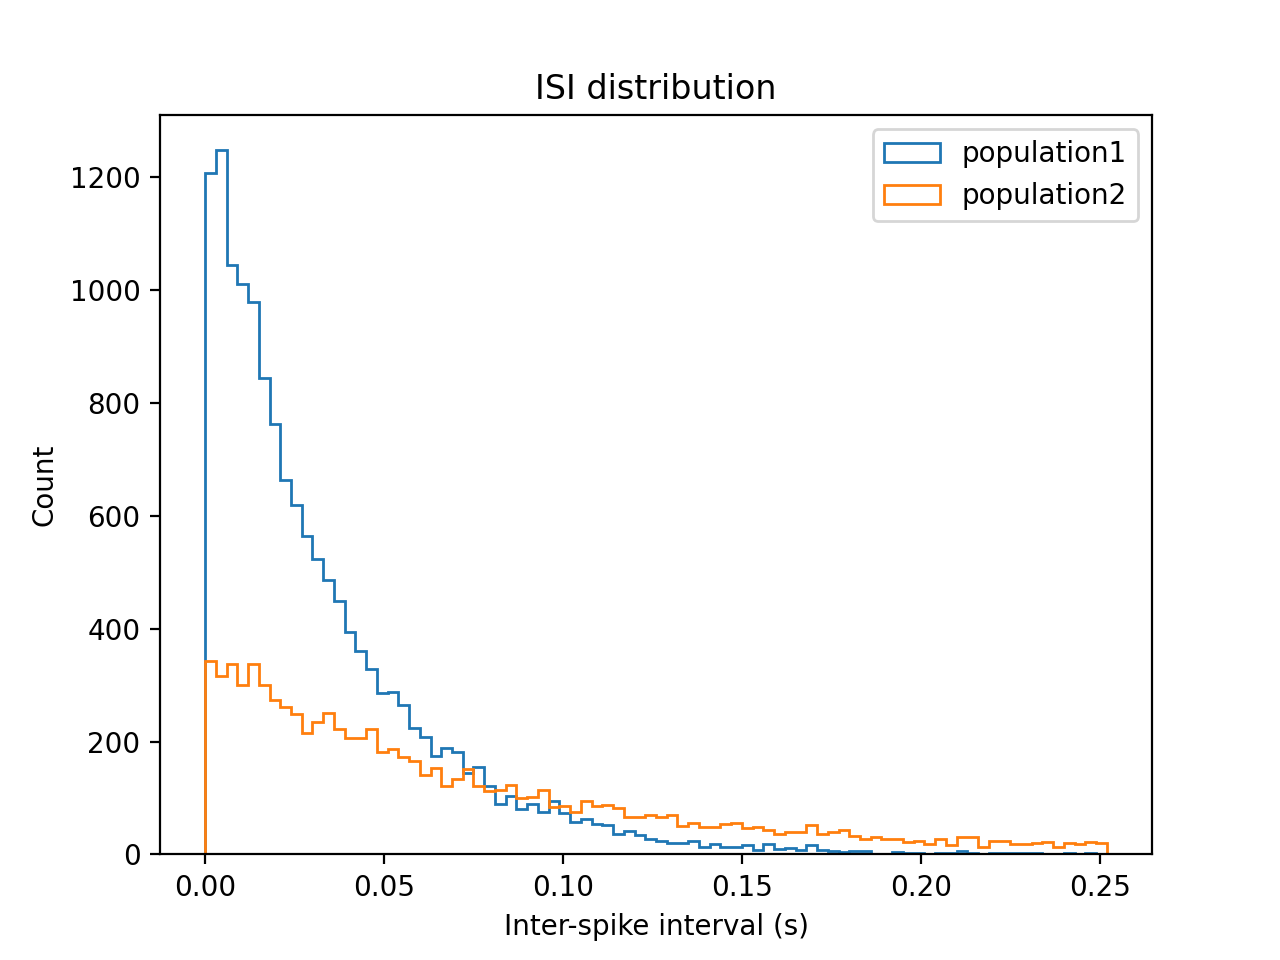
ISI histogram of multiple neuron populations.
import quantities as pq
import matplotlib.pyplot as plt
from elephant.spike_train_generation import homogeneous_poisson_process
from viziphant.statistics import plot_isi_histogram

np.random.seed(12)
population1 = [homogeneous_poisson_process(rate=30 * pq.Hz,
               t_stop=50 * pq.s) for _ in range(10)]
population2 = [homogeneous_poisson_process(rate=r * pq.Hz,
               t_stop=50 * pq.s) for r in range(1, 20)]
plot_isi_histogram([population1, population2], cutoff=250 * pq.ms,
                   legend=['population1', 'population2'])
plt.show()
(
Source code,png,hires.png,pdf)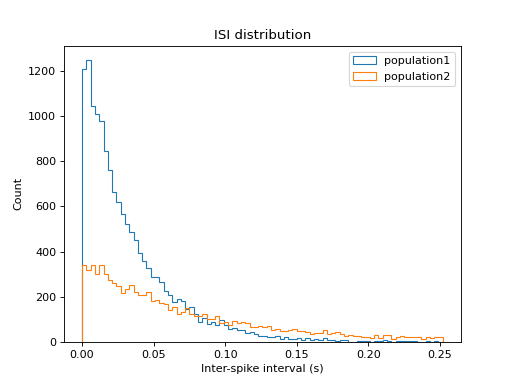